


You are here
Net zero by 2050 only possible if renewables ramp up: expert
![Figure 1 shows the Deployment speed of PV and wind for 2018 (red) and 2019 (green) in terms of Watts per person per year [IRENA]. Recent data for Australia in 2020 (blue) from the Clean Energy Regulator is also included.](https://iceds.anu.edu.au/files/styles/anu_full_920_518/public/Figure-1%20-%20920x518.jpg?itok=p-XFS10P)

Australia will not achieve net zero emissions until well after 2050 at the rate emissions are declining, experts from The Australian National University (ANU) warn. Read the entire article in the ANU Newsroom.
Technical Paper - Australia: 80% emissions reduction by 2040
This Technical Paper by Professor Andrew Blakers, Professor Ken Baldwin, and Associate Professor Matthew Stocks accompanies the story 'Net zero by 2050 only possible if renewables ramp up: expert' published on 17 March 2021.
Summary
- Australia has declining electricity emissions and declining electricity prices. This means that deep emissions reductions will have low or negative cost.
- Australia continues its world-leading per capita deployment of solar and wind.
- Fossil fuel energy causes 80% of Australia’s emissions.
- We reach zero fossil energy in 2040 by doubling the average solar and wind deployment rate.
Australia’s world-leading per capita solar and wind deployment continues. The consequences of this are (i) falling emissions from the electricity system; (ii) falling electricity prices; (iii) declining use of gas; and (iv) rapidly increasing renewable energy generation shares.
According to estimates from the Clean Energy Regulator, 7 Gigawatts of new solar and wind energy capacity was added in 2020. As a consequence, renewable electricity reached 30% in the National Electricity Market and 70% in South Australia and is tracking towards 45% and 100% respectively in 2024.
Latest Government data shows that Australian greenhouse emissions fell by 4.4% in the year to September 2020. New renewable energy capacity is reducing emissions in the electricity sector while COVID-19 reduced transport emissions (transport emissions are expected to rise again post-pandemic).
Remarkably, wholesale spot electricity prices halved in the past year compared with the average over 2016-19.
The fact that Australia is reducing electricity emissions and prices is significant ahead of Australia’s positioning for the COP26 Climate Change conference in Glasgow in November. Additionally, parties are formulating their positions for the next Federal election.
If Australia installs solar and wind faster, then electricity emissions will fall faster while prices remain low.
Australia is well placed to accelerate deployment of low-cost solar and wind to reach zero fossil fuel energy by 2040 through renewable electrification of all fossil energy services. This would allow an 80% reduction in Australian emissions. This good news is tempered by the urgent need for additional powerlines to efficiently bring new solar and wind power to the cities.
Australia’s global leadership
Solar and wind comprise two thirds of global net annual capacity additions, with fossil, hydro and nuclear energy accounting for balance. In Australia, solar PV and wind comprise 99% of new generation capacity because they are cheaper than fossil fuels.
Australia is deploying new renewable energy 10 times faster per capita than the global average and 4 times faster per capita than in Europe, China, Japan or the USA (Fig. 1). Australia (per capita) has the most installed solar PV and the fastest combined deployment speed of solar PV and wind. Australia is a pathfinder for the three quarters of humanity who live in the sunbelt where most of the world’s growth in population, energy use and Greenhouse emissions are occurring.

Figure 1: Deployment speed of PV and wind for 2018 (red) and 2019 (green) in terms of Watts per person per year [IRENA]. Recent data for Australia in 2020 (blue) from the Clean Energy Regulator is also included.
Solar and wind in Australia
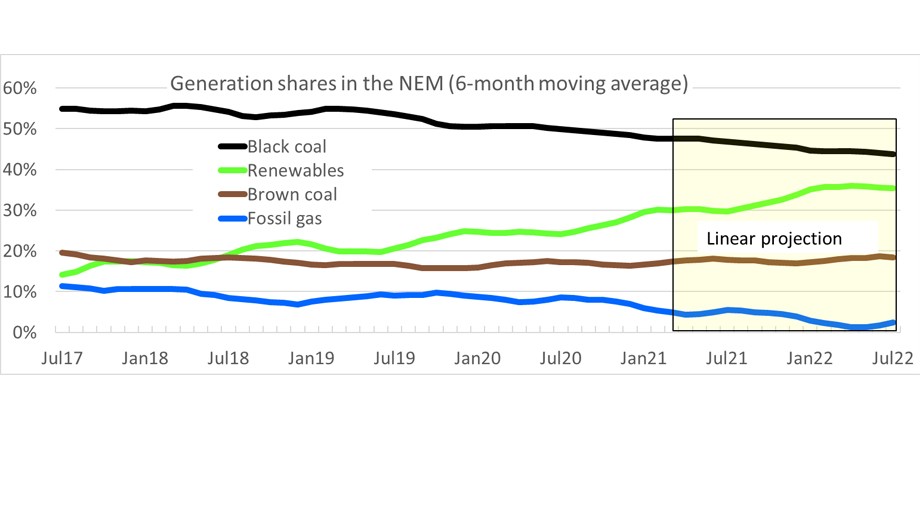
Renewable electricity reached 30% in the National Electricity Market (Fig. 2) and is tracking towards 50% renewables in 2025 (linear projection).
Gas is declining to low levels because it is expensive compared with solar and wind and storage.

Figure 2: Renewable generation in the National Electricity Market reached 30%.
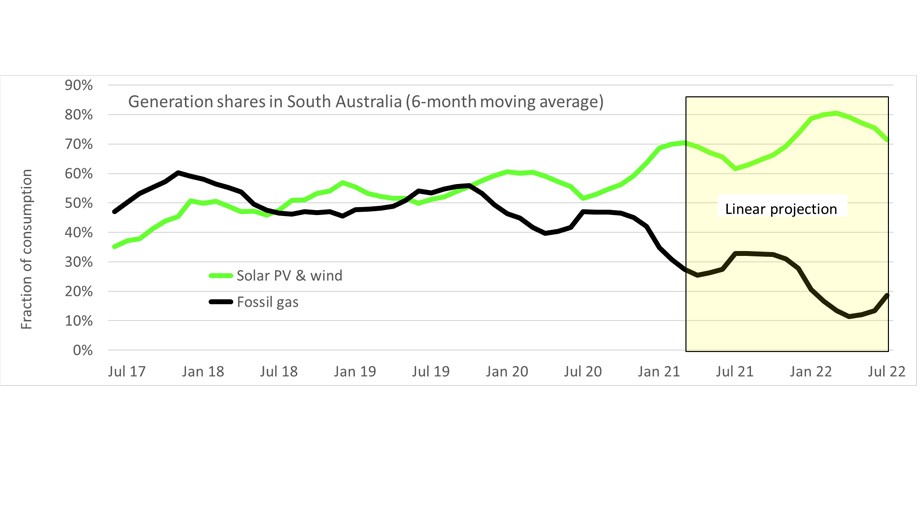
Solar and wind electricity in South Australia reached 70% (Fig. 3) and is tracking towards 100% in 2025 (linear projection). South Australia is an important global exemplar of rapid and sustained growth in renewable energy.
Gas is declining because it cannot compete with solar and wind.

Figure 3: Solar PV and wind electricity generation in South Australia reached 70%
The Clean Energy Regulator estimates that 7 Gigawatts (GW) of new renewable capacity was added in 2020 comprising 4 GW of utility scale wind and solar farms and 3 GW of rooftop solar. This brings the total over 2018-20 to 18 GW. The pipeline of new solar and wind remains strong until at least 2022. Costs of solar and wind are continually falling. Expanding markets include large-scale voluntary purchases of renewable electricity, mining precincts and commercial building rooftops “behind the meter”.
Declining electricity prices
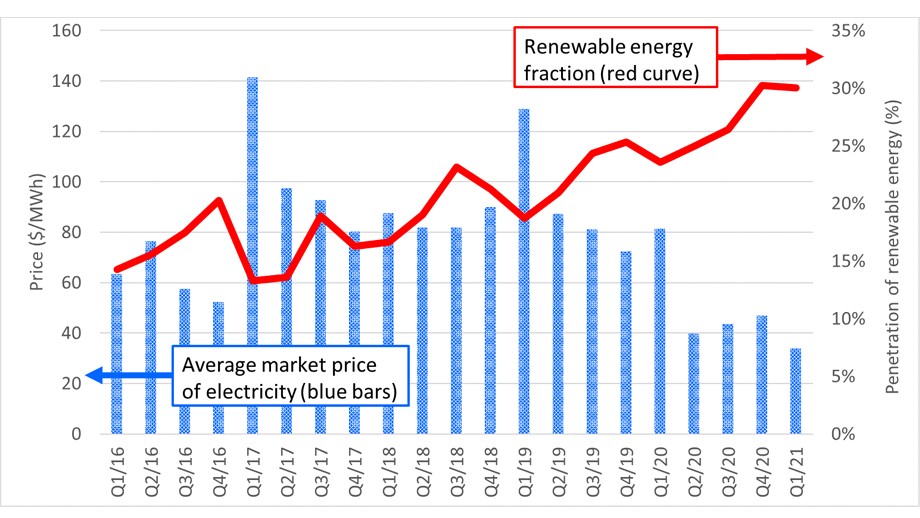
Australia is experiencing low wholesale electricity prices (Fig. 4). Prices halved over the past year compared with the average over 2016-19 as a flood of new solar and wind electricity enters the market.

Figure 4: Wholesale prices (blue bars, LH axis) and renewable energy fraction in the NEM (red curve, RH axis).
Continuing reductions in the price of solar and wind may cause a wave of early coal generator retirements during the 2020s. The early closure of the 1.5 Gigawatt Yallourn power station was recently announced.
The renewable energy industry is now worth $11 Billion per year (including both rooftop and utility solar and wind systems) and is employing 27,000 people.
Balancing solar and wind
Balancing variable PV and wind is straightforward using off-the-shelf techniques: stronger long distance transmission (to smooth out variable local weather), storage (pumped hydro and batteries) and demand management. Australia has 4000 potential pumped hydro sites with combined energy storage potential of 180 TWh, which is about 300 times more than required to support 100% renewable electricity. About a dozen large pumped hydro systems are under serious consideration, while the Snowy 2.0 system is under construction.
Pumped hydro and batteries are being deployed at Gigawatt scale to manage Australia’s rapidly increasing PV and wind. However, stronger transmission is urgently needed to bring new solar and wind power to the cities. An effective way to do this is to upgrade transmission lines from rural Renewable Energy Zones to the cities. The “Step Change” scenario in the Australian Energy Market Operator’s 2020 Integrated System Plan is a guide to the changes needed in the electricity system. The 2021 Plan will include a scenario that assumes much faster renewable energy deployment and associated emissions reductions.
Zero fossil fuel energy
Greenhouse emissions from electricity have been falling since 2016 because solar and wind are pushing out coal and gas. However, emissions outside electricity were rising until the impact of COVID-19 was felt. Overall, emissions have slowly fallen since 2018 (Figure 5).

Figure 5: Australian annual emissions to September 2020 from electricity (green bars) and everything else combined (blue bars).
The National Greenhouse Gas Inventory shows that Australia’s emissions fell 4.4% in the year to September 2020. Much of the decline resulted from COVID causing reduced transport emissions – which will rise towards normal during 2021. Fast declines in emissions requires faster deployment of solar and wind.
Europe, China, Japan, Korea, the USA and many other countries have pledged zero emissions by 2050-60. All State and Territory governments have committed to zero emissions in 2050, although not yet the Commonwealth Government.
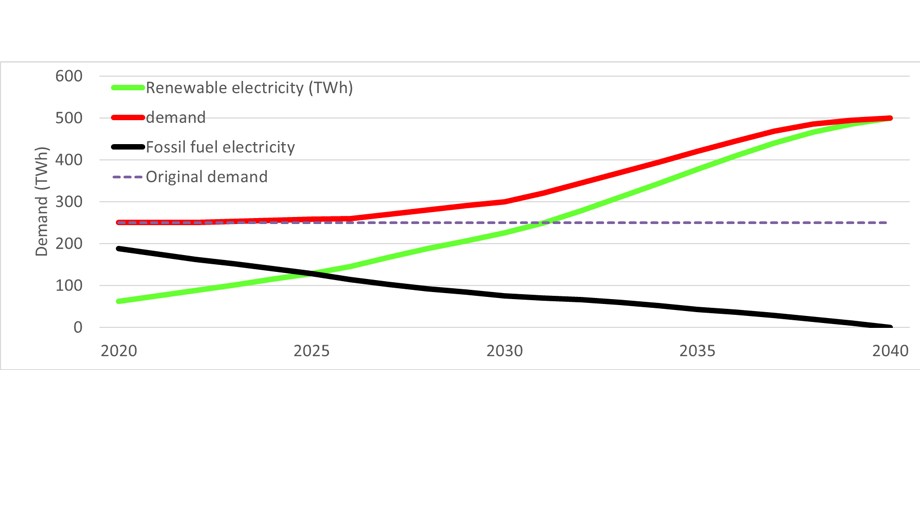
Complete renewable electrification of transport, heating and industry in Australia requires a doubling of electricity production and complete displacement of fossil fuel energy by solar and wind. This allows an 80% reduction in emissions (including cessation of the export of coal and gas and the associated fugitive emissions).
Zero fossil fuel energy can be achieved in 2040 assuming sustained solar and wind deployment rates of 14 Gigawatts per year, which is double the current rate. [Assumption: 18% capacity factor averaged across rooftop PV, solar farms and wind farms].
A possible scenario for zero fossil fuel energy in 2040 is shown in figure 6. This is not so hard considering the ever-falling price of solar and wind, and the fact that their current deployment rate is already seven times faster than in 2015.
The economics of PV and wind are compelling. Australia is demonstrating that rapid deployment of solar and wind can lead to declining emissions and low electricity prices. Now is the time to plan ahead to accelerate renewable deployment and decarbonize the entire economy.

Figure 6: Scenario of rising electricity demand caused by renewable electrification of transport, heating and industry, which is met by solar and wind. This allows zero fossil fuel energy in 2040 and an 80% reduction in emissions.